
Reducing Variability and Hands-On time in Viral Vector purification using the OptiMATE Gradient Maker
Introduction
In this application note, we demonstrate an automated method to achieve high-resolution purification of AAV capsids with over 80% reduction in hands-on time, minimal variability, and no compromise in purification efficiency.

- Automated dispense and tube sealing
- High accuracy and consistency
- Simple GUI and operation
- Compact format for BSC or benchtop
Adeno-associated viruses (AAVs) are powerful delivery vectors for gene therapies.1 However, as AAVs assemble, they package nucleic acid cargo inefficiently, leading to only a small portion of viral particles carrying the gene of interest.2,3 Enrichment of these fully-loaded particles is a critical step in downstream purification workflows.4 A 15-60% w/v iodixanol (IDX) step gradient is an established primary step for purifying AAV capsids with ultracentrifugation from cellular contaminants.5
Setting up an iodixanol step gradient is laborious and can lead to variability depending on operator skill level. To address this fundamental challenge, we developed an automated solution called the OptiMATE Gradient Maker. This system eliminates hands-on steps in gradient preparation including stock reagent preparation, dispensing gradients, and sealing tubes. The OptiMATE Gradient Maker can be used to run established protocols with higher consistency, accuracy, and ease of use.
Methods
Gradient Profiling
First, we wanted to confirm that the OptiMATE Gradient Maker can dispense the standard IDX step gradient typically used for AAV purification,5 with performance equal to or better than manual dispensing. For this experiment, nanopure water was used as a control in place of AAV, and food coloring was added for easier visualization. Nanopure water was dyed yellow and IDX was dyed blue using food coloring. A method was created on the OptiMATE system to dispense a step density gradient ranging from 15-60% w/v OptiMATE IDX, 1 M NaCl, 1x Phosphate Buffered Saline (PBS), and nanopure water into 39 mL Quick-Seal Polypropylene tubes (Table 1). The tubes were then sealed on the OptiMATE system.
For comparison, additional tubes were manually filled via the underlay method with the same density gradient steps and then sealed using a Cordless Tube Topper (Figure 1). All tubes were weighed to perform a balance check before being loaded into a Type 70 Ti rotor and centrifuged at 63,000 rpm (407,427 x g) for 2 hours at 16° C in an Optima XPN-90 ultracentrifuge. After centrifugation, tubes were fractionated through bottom puncture into approximately 1.5 mL fractions and analyzed using a refractometer.
| 13.5 mL tubes | 39 mL tubes |
|---|---|
| Total | 39 |
| Sample (AAV or water) | 12 |
| 15% (with 1 M NaCl) | 8 |
| 25% | 6 |
| 40% | 8 |
| 60% | 5 |
Table 1. Tube composition for comparative IDX control study.
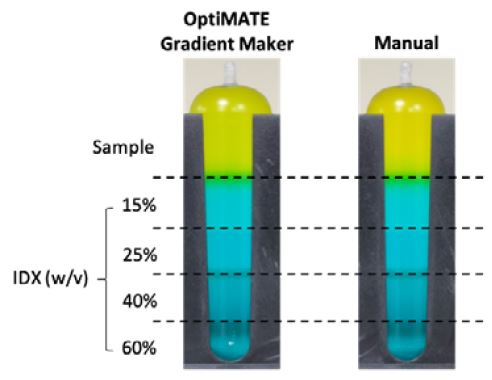
Figure 1. Comparison of IDX step density gradient tubes dispensed by OptiMATE Gradient Maker (left) and dispensed manually (right) before sealing and centrifugation. Sample is yellow, IDX is blue, and the green band is simply an artifact from interfacial mixing of blue and yellow.
AAV Purification
AAV serotype 2 was expressed via triple transfection in HEK-293 cells. Following expression, cells were lysed and centrifuged to remove debris. The clarified lysate containing AAV was then purified using a 15-60% (w/v) IDX step density gradient, similar to the gradient profiling experiment (Table 1, Figure 2). For automated preparation, the gradient steps were dispensed into 39 mL Quick-Seal Polypropylene tubes using the OptiMATE Gradient Maker. Each tube was loaded with 2.08 x 10¹² viral genomes (vgs) of AAV. For manual preparation, IDX stock solutions (15%, 25%, 40%, and 60%) were prepared using OptiMATE IDX and layered into tubes using a syringe and blunt-end cannula via the underlay method. Manually prepared tubes were sealed with the Cordless Tube Topper, while OptiMATE-prepared tubes were sealed automatically on the instrument. Tubes were centrifuged in a Type 70 Ti rotor at 63,000 rpm (407,427 x g) for 2 hours at 16 °C in an Optima XPN-90 ultracentrifuge. After centrifugation, AAV bands (at the 40%-60% IDX interface) were extracted via side puncture and buffer exchanged using a centrifugal spin filter. Vgs were quantified via qPCR (AAVPro titration kit, Takara Bio) to assess recovery.

Figure 2. Purification scheme for IDX density gradient experiment comparing automated dispense (top) and manual dispense (bottom) of a 15-60% w/v IDX step gradient with AAV.
Results
We assessed the control gradients both by weight and by measuring the refractive index of the dispensed gradients with a refractometer. The measured weights demonstrate low variability between tubes after automated dispensing and sealing (Table 2). Although the variability in manually-dispensed tubes was also low, variability can be exacerbated if the operator is not adequately skilled.
Figure 3 shows the plot of density versus cumulative tube volume. An OptiMATE-dispensed IDX step gradient has high accuracy, sharper interfaces, and stays within limits allowed by pipetting errors when compared to a theoretically calculated IDX step gradient.6 There is some diffusion between the layers in both methods that can be attributed to interfacial mixing and diffusion induced by the fractionation process.
| Method | Tube Weight (g) |
|---|---|
| OptiMATE Gradient Maker | 48.86 ± 0.07 |
| Manual | 48.21 ± 0.25 |
Table 2. Weight variability with manually dispensed and OptiMATE Gradient Maker-dispensed tubes. Error values are standard deviation (n=6).
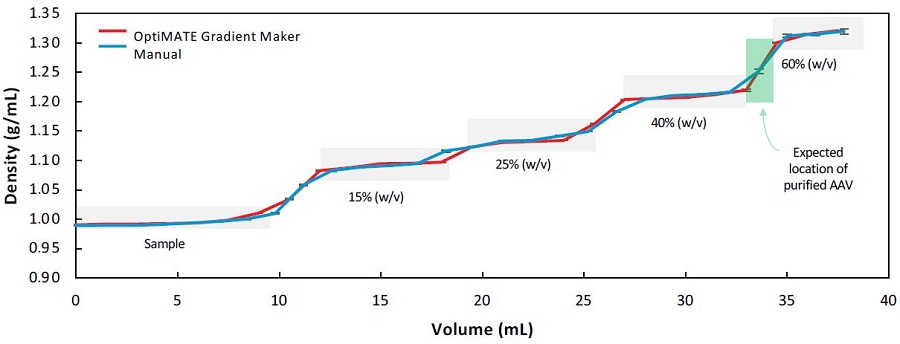
Figure 3. Comparison of gradient profiles from OptiMATE Gradient Maker (red) and manual (blue). A theoretical curve based on expected density values for the different IDX layers with expected pipetting error is also shown (light gray boxes). The green box marks the expected location of AAV capsids (at the 40%-60% w/v interface) on the curve. Error bars are standard deviation (n=3).
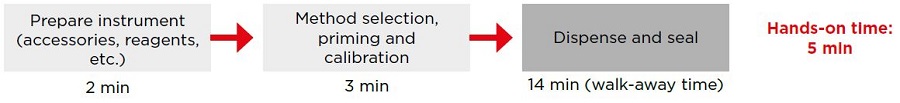
Figure 4 compares the time to prepare tubes manually versus with the OptiMATE Gradient Maker. We do not account for time taken for numerical calculations or the creation of the method, as these may be one-time activities. Dispensing two 39 mL Quick-Seal tubes with the OptiMATE Gradient Maker is significantly faster than manual dispensing. While the total time was 31 minutes for OptiMATE Gradient Maker and 19 minutes for manual (a 39% reduction), the hands-on time was reduced from 31 minutes manually to just 5 minutes with OptiMATE Gradient Maker (an 84% reduction), highlighting a substantial decrease in time and effort. Since the OptiMATE system dispenses and seals tubes in parallel, increasing the number of tubes would further amplify the time difference.
OptiMATE Gradient Maker
Manual Process
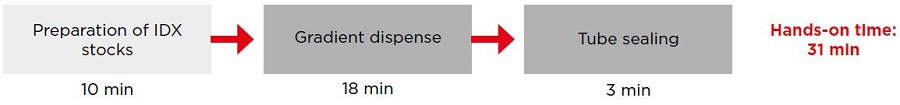
Figure 4. Schematic of IDX step density gradient setup for two 39 mL Quick-Seal tubes manually or using the OptiMATE Gradient Maker. Preparation steps are in light gray while dispense and seal steps are in dark gray.
After confirming equivalence in the control gradients, we proceeded with the AAV experiment to validate consistency with the established protocol. To assess AAV purification efficiency, the bands recovered from the tubes containing the AAV2 sample were analyzed for filled capsids using qPCR and compared (Table 3). The tubes were also inspected visually before and after centrifugation (Figure 5) and matched the expected appearance.5
The amount of AAV recovered for samples purified using both methods are similar, and match typically expected values7 from IDX step gradient purification. Since the main goal of this purification was to separate AAV2 capsid material from cellular impurities in the primary purification step rather than distinguish empty and full capsids, we focused only on measuring vgs recovery.
| Method | Concentration (vg/mL) | Amount recovered (vg) | % vg recovery |
|---|---|---|---|
| OptiMATE Gradient Maker | 1.57E+12 | 8.16E+11 | 39.24% |
| Manual | 1.76E+12 | 8.08E+11 | 38.84% |
Table 3. qPCR analysis results of recovered AAV2 after purification.
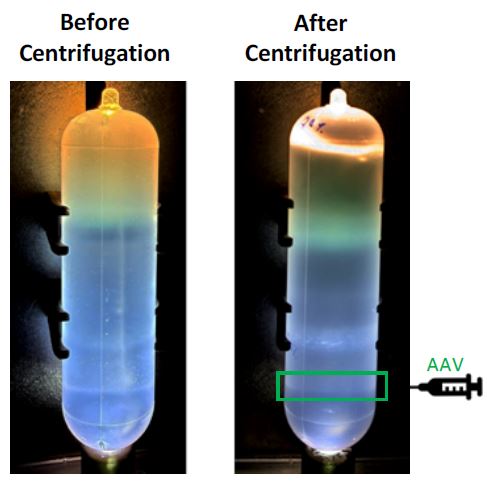
Figure 5. IDX step gradient tubes before and after centrifugation. The green box highlights the location (40-60% w/v interface) where AAV was extracted from.
Conclusion
The OptiMATE Gradient Maker precisely dispenses step gradients, addressing two major challenges in density gradient ultracentrifugation: labor and variability. This is evidenced by the consistent density profiles and expected recovery of AAV2 vgs post-purification. Its user-friendly method creation, automation, and precision allow even new users to begin purifying samples on day one. The rapid setup and minimal hands-on time streamline the workflow while reducing operator exposure to chemicals and biological materials. Furthermore, the instrument integrates seamlessly into existing purification processes, lowering skill barriers for creating high-quality step density gradients and enhancing overall process efficiency.
References
- Wang, Jiang-Hui, et al. “Adeno-Associated Virus as a Delivery Vector for Gene Therapy of Human Diseases.” Signal Transduction and Targeted Therapy, vol. 9, no. 1, Apr. 2024, pp. 1–33
- Mietzsch, Mario, et al. “Improved Genome Packaging Efficiency of Adeno-Associated Virus Vectors Using Rep Hybrids.” Journal of Virology, vol. 95, no. 19, pp. e00773-21
- Wright, J. Fraser. “Product-Related Impurities in Clinical-Grade Recombinant AAV Vectors: Characterization and Risk Assessment.” Biomedicines, vol. 2, no. 1, Mar. 2014, pp. 80–97
- Administration UFaD. Chemistry, manufacturing, and control (CMC) information for human gene therapy investigational new drug applications (inds). 2020, Administration UFaD, 2021
- Zolotukhin, S., et al. “Recombinant Adeno-Associated Virus Purification Using Novel Methods Improves Infectious Titer and Yield.” Gene Therapy, vol. 6, no. 6, June 1999, pp. 973–85
- Graham, John. “OptiPrepTM Density Gradient Solutions for Mammalian Organelles.” The Scientific World JOURNAL, vol. 2, 2002, pp. 1440–43. Semantic Scholar, https://doi.org/10.1100/tsw.2002.840.
- Lam, Anh K., et al. “Comprehensive Comparison of AAV Purification Methods: Iodixanol Gradient Centrifugation vs. Immuno-Affinity Chromatography.” Advances in Cell and Gene Therapy, vol. 2023,
| Item Description | Part Number |
|---|---|
| Quick-Seal Round-Top Polypropylene Tube |
342414 |
| OptiMATE Iodixanol Solution | D01358 |
| Tube Topper Kit (50 Hz) | 358314 |
| Type 70 Ti Rotor | 337922 |
| OptimaXPN-90 | A99842 |

