Echo System-Enhanced SMART-Seq v4 for RNA Sequencing
Introduction
As the cost of sequencing has continued to decline by orders of magnitude in the past ten years, scientists are enabled to ask deeper and more complex questions about transcriptomics. Consequently, the variety, quantity, and demands of RNA sequencing experiments have all increased. The Clontech SMART-Seq v4 Ultra Low Input RNA Kit incorporates the SMART (Switching Mechanism at 5’ End of RNA Template) technology. This technology utilizes the template switching activity of reverse transcriptases to add PCR adapters directly to both the 5’ and 3’ ends of the first-strand cDNA before amplification using LD PCR. Here, we document information and results pertaining to the miniaturization of this process utilizing the Echo 525 Liquid Handler, effectively reducing the reagent cost and processing time for the workflow, addressing current throughput needs of RNA sequencing.
Overview
SMART-Seq v4 Workflow to Generate cDNA Libraries
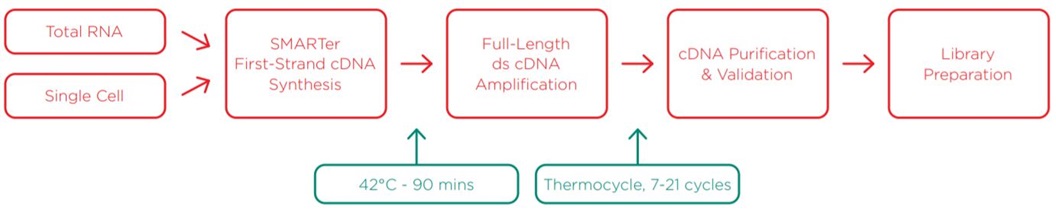
In this experiment, we aimed to cover conditions for applications ranging from total RNA of a cell population to single-cell RNA sequencing. We tested a combination of reducing reaction volume, varying amounts of sample input, and varying the number of PCR cycles, looking for optimal parameters for quality sequencing for various situations. For this experiment, human brain total RNA was used as the input sample. We utilized the Echo 525 Liquid Handler to transfer small, accurate, and precise amounts of sample and reagents throughout the workflow to achieve miniaturized reaction volumes. Details of this method are described in the methods section.
Nextera XT Library Preparation Workflow to Generate Libraries for Sequencing
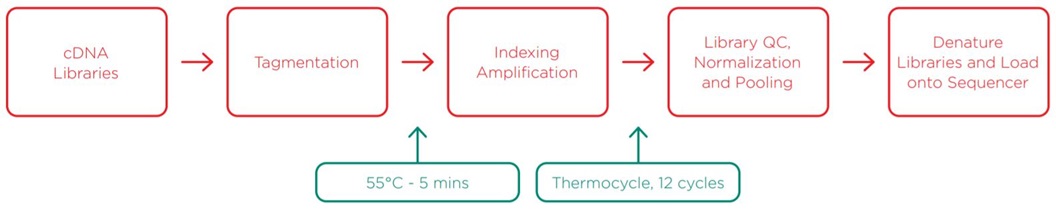
After QC of the cDNA library generated from the SMART-Seq v4 workflow, we processed the samples through Illumina Nextera XT library preparation for sequencing. Miniaturized Nextera XT conditions have been previously optimized, as detailed in Application Note G121, as well as the publication “Low-Cost, high-throughput sequencing of DNA assemblies using a highly multiplexed Nextera process.” Shapland et al. ACS Synth. Biol., 2015. The Echo 525 Liquid Handler was used throughout this workflow to transfer small, accurate, and precise amounts of sample and reagents to achieve miniaturized reaction volumes. Details of this method are described in the methods section.
Method
SMART-Seq v4 Workflow
Reaction volumes tested: 1/4, 1/5, 1/8, 1/10, 1/16, 1/20, 1/32
Input RNA (human brain total RNA) amounts tested: 10pg, 30pg, 100pg, 300pg, 1000pg
Number of PCR cycles tested: 6, 9, 12, 15, 18, 21
| Making 10x Reaction Buffer | Protocol (µL/rxn) | 1/4 | 1/5 | 1/8 | 1/10 | 1/6 | 1/20 | 1/32 |
| 10x lysis buffer | 19 | 4.75 | 3.8 | 2.375 | 1.9 | 1.1875 | 0.95 | 0.6 |
| RNase inhibitor (40U/µL) | 1 | 0.25 | 0.2 | 0.125 | 0.1 | 0.0625 | 0.05 | 0.05 |
| Total volume | 20 | 5 | 4 | 2.5 | 2 | 1.25 | 1 | 0.65 |
Mix and spin @ 1500g, 1 minute
| Lysis | Protocol (µL/rxn) | 1/4 | 1/5 | 1/8 | 1/10 | 1/6 | 1/20 | 1/32 | Echo Calibration |
| 10x reaction buffer | 1 | 0.250 | 0.200 | 0.125 | 0.100 | 0.075 | 0.05 | 0.05 | 384PP_AQ_SP_High |
| Cells or purified RNA sample | 1 | 0.250 | 0.200 | 0.125 | 0.100 | 0.075 | 0.05 | 0.05 | 384PP_AQ_BP |
| dH2O | 8.5 | 2.125 | 1.700 | 1.075 | 0.850 | 0.55 | 0.45 | 0.275 | 384PP_AQ_BP |
| Total volume | 10.5 | 2.625 | 2.100 | 1.325 | 1.050 | 0.7 | 0.55 | 0.375 |
Spin @ 1500g, 1 minute ➡Incubate 5 minutes, room temperature
| Add CDS Primer | Protocol (µL/rxn) | 1/4 | 1/5 | 1/8 | 1/10 | 1/6 | 1/20 | 1/32 | Echo Calibration |
| 3' SMART-Seq CDS Primer II A (12 µM) | 2 | 0.5 | 0.4 | 0.25 | 0.2 | 0.125 | 0.1 | 0.075 | 384PP_AQ_BP |
Mix and spin @ 1500g, 1 minute ➡Incubate at 72°C in a preheated, hot-lid thermal cycler for 3 minutes ➡Snap cool on ice for 2 minutes, spin
| 1st Strand cDNA Synthesis | Protocol (µL/rxn) | 1/4 | 1/5 | 1/8 | 1/10 | 1/6 | 1/20 | 1/32 | Echo Calibration |
| 5x ultra low first strand buffer | 4 | 1 | 0.8 | 0.5 | 0.4 | 0.25 | 0.2 | 0.125 | |
| SMART-Seq v4 oligonucleotide (48 μM) | 1 | 0.25 | 0.2 | 0.125 | 0.1 | 0.075 | 0.05 | 0.025 | |
| RNase inhibitor (40 U/μL) | 0.5 | 0.125 | 0.1 | 0.075 | 0.05 | 0.05 | 0.025 | 0.025 | |
| SMARTscribe reverse transcriptase (100 U/μL) | 2 | 0.5 | 0.4 | 0.25 | 0.2 | 0.125 | 0.1 | 0.075 | |
| Total volume / reaction | 7.5 | 1.875 | 1.5 | 0.95 | 0.75 | 0.5 | 0.375 | 0.25 | 384PP_AQ_GPSa |
Mix gently and spin ➡RT reaction ➡42°C (90 min) ➡70°C (10 min) ➡4°C (forever) ➡Spin @ 1500g, 1 minute
| cDNA Amplification | Manual (µL/rxn) | 1/4 | 1/5 | 1/8 | 1/10 | 1/6 | 1/20 | 1/32 | Echo Calibration |
| 2X SeqAmp PCR buffer | 25 | 6.25 | 5 | 3.125 | 2.5 | 1.5625 | 1.25 | 0.8 | |
| PCR Primer IIA (12 uM) | 1 | 0.25 | 0.2 | 0.125 | 0.1 | 0.0625 | 0.05 | 0.075 | |
| SeqAmp DNA polymerase | 1 | 0.25 | 0.2 | 0.125 | 0.1 | 0.0625 | 0.05 | 0.075 | |
| dH2O | 3 | 0.75 | 0.6 | 0.375 | 0.3 | 0.1875 | 0.15 | 0.1 | |
| Total volume / reaction | 30 | 7.5 | 6 | 3.75 | 3 | 1.875 | 1.5 | 1.05 | 384PP_AQ_GPSb |
| PCR Reaction | Time | Input amount RNA (ng) | Input number of cells | Typical number of PCR cycles |
| 95°C | 1 min | 10 | 1000 | 7-8 |
| 98°C | 10 sec |
1 |
100 | 10-11 |
| 65°C | 30 sec | 0.1 | 10 | 14-15 |
| 68°C | 3 min | 0.01 | 1 | 17-18 |
| 72°C | 10 min | |||
| 4°C | forever |
SPRI bead cleanup was performed on the cDNA product, to minimize any interference with the Nextera XT process. SPRI bead cleanup followed the Agencourt AmpureXP PCR purification protocol for 384- well format. We utilized 9µL of beads for our 5μL cDNA amplification reaction, and eluted in 20μL.
Reproducible sample preparation is dependent on the quality of the input material. Evaluation of starting total RNA quality is important. Sequence complexity and average length of the cDNA are adversely affected by quality and quantity of the starting material. When using FACS sorting single cells, avoid transferring the culture medium into the lysis buffer. Where possible wash and resuspend cells in PBS prior to lysis to avoid inhibition of the first-strand cDNA synthesis reaction.
During second strand cDNA synthesis determine the optimal number of PCR cycles for your starting material. It is not uncommon for the number to increase by 3-5 cycles above the recommended number, as optimal conditions do vary amongst cell types.
Library quantitation was performed to verify cDNA libraries and to normalize input into the Nextera XT process. The Picogreen fluorescence-based quantitation assay was used to determine the concentration of cDNA products. The Picogreen protocol was performed according to the ThermoFisher standard protocol, but volumes were miniaturized 1/100 from 2mL to 20μL in a Greiner 384-well clear-bottom plate. The Echo 525 Liquid Handler was used to dispense cDNA samples and Picogreen reagents into the Greiner 384-well plate. Results were read on the BMG Pherastar spectrophotometer.
Nextera XT Workflow
| Tagmentation | Protocol (µL/rxn) | 1/10 | Echo Calibration |
| cDNA sample | 5 | 0.5 | 384PP_AQ_BP |
| TD buffer | 10 | 1 | 384PP_AQ_GP |
| ATM | 5 | 0.5 | 384PP_AQ_GPSB |
| Total volume | 20 | 2 |
Spin @ 1500g, 1 minute ➡Tagmentation reaction ➡55°C (5 min) ➡10°C (forever)
| Add NT | Protocol (µL/rxn) | 1/10 | Echo Calibration |
| Tagmentation reaction | 20 | 2 | From previous |
| NT buffer | 5 | 0.5 | 384PP_AQ_SPHigh |
| Total volume | 25 | 2.5 |
Spin @ 1500g, 1 minute ➡Incubate 5 min RT
| PCR Reaction | |
| 72°C | 3 min |
| 95°C | 30 sec |
| 95°C | 10 sec |
| 55°C | 30 sec |
| 72°C | 30 sec |
| 72°C | 5 min |
| 4°C | forever |
Library QC is necessary to verify the quantity of each sample, and fragment analysis must be considered when normalizing, pooling, and diluting for MiSeq loading. Picogreen quantitation assay was performed again as described above. Fragment size analysis was performed on the Agilent TapeStation 2200, according to the Agilent standard protocol. The Echo 525 Liquid Handler was used to transfer cDNA samples and reagents into the Agilent 96-well destination plate, then loaded and read in the TapeStation 2200.
Using the concentration data from the Picogreen assay, as well as fragment size information from the TapeStation 2200, we built a normalization worklist in Excel to obtain equimolar pooling of samples. Normalization can be accomplished simultaneously during pooling using the Echo 525 Liquid Handler and the worklist, in minutes. Normalization is a function of the desired amount of reads allotted to each sample. For our purposes, we seek even distribution of reads to all samples.
Results and Discussion
After running our matrix of sample conditions (miniaturization, reducing input, varying cycles) through the SMART-Seq v4 process, we then performed SPRI bead cleanup and quantitated all cDNA libraries. We were aiming to achieve a minimum cDNA library concentration of 0.2ng/μL, so that we have at least 0.1 ng total DNA going into a 2.5μL tagmentation reaction. In the graphs below, we have set the bottom portion of the graph to 0.2ng/μL, our QC threshold for sample minimum concentration. An additional graph stacked on top of the bottom portion indicates the quantity of those libraries that passed the 0.2ng/μL threshold for our Nextera XT library preparation workflow.
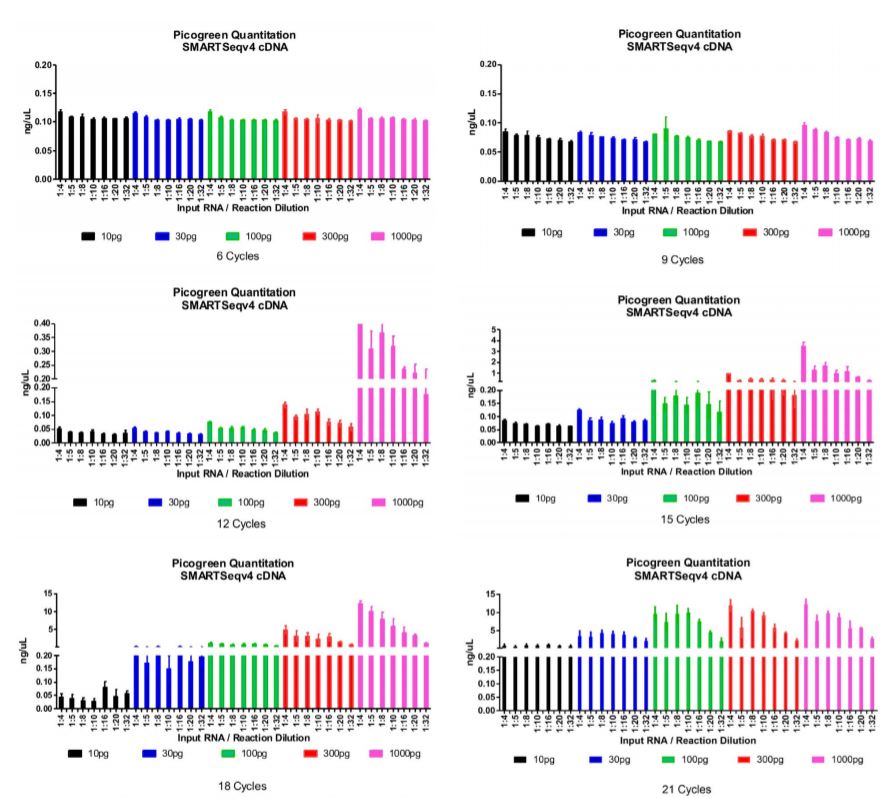
Figure 1: Picogreen quantitation of the cDNA libraries after SMART-Seq v4 and SPRI bead cleanup processes. Data is organized by number of thermocycles, input RNA, and reaction miniaturization amount. The bottom graph represents the quantity of each sample condition (replicated) and 0.2 ng/μL QC threshold for proceeding to Nextera XT. The top graph represents the total quantity of each sample condition (replicated) beyond the threshold mark. We found that 18x cycling is a good condition for most input RNA amounts and reaction sizes while minimizing amplification bias. Cycling does need to be increased to start from single-cell (10pg).
We picked all samples from the 18x cycle plate, and processed them through our Echo Liquid Handlerenhanced Nextera XT workflow. While cDNA libraries from 10pg input RNA did not produce the minimum amount of DNA for Nextera XT, we added max volumes (0.5μL) and ran them anyway. These samples are at risk of producing smaller fragments or not producing a Nextera XT library at all. We chose the 18x cycle plate because it was the cycling condition that was most permissive of input RNA and reaction size while minimizing amplification bias. Based on our demonstrated matrix, a few conditions can be chosen for your process depending on your input sample and desired miniaturization. After sequencing, a small portion of these libraries failed to produce enough reads (>100,000) for the RNA Express workflow on Illumina BaseSpace. To begin with 10pg input RNA, more cycling is necessary for sufficient library and read generation.
Nextera XT reagents and cDNA libraries were transferred in 1/10 volume of the recommended protocol by the Echo 525 Liquid Handler. After the Nextera XT library preparation, samples were cleaned up using SPRI beads, then QC’d using Picogreen quantitation and TapeStation 2200 fragment analysis.
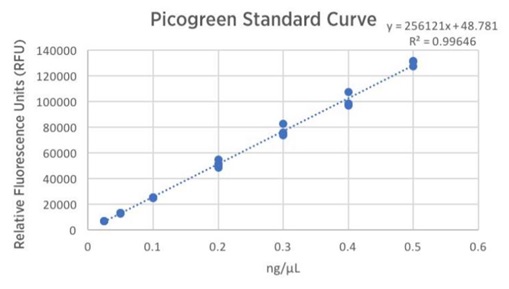
Figure 2: Picogreen standard curve generated by using the Echo 525 Liquid Handler. The instrument is able to perform accurate and precise transfers of the lambda DNA used in this standard curve by direct dilution, avoiding propagation of errors in serial dilution.
Picogreen Quantitation Data - RFUs converted to [DNA]
| ng/µL | 1 | 2 | 3 | 4 | 5 | 6 | 7 | 8 | 9 | 10 |
| A | 3.547 | 3.48 | 3.574 | 3.719 | 2.76 | 3.031 | 2.563 | 3.311 | 1.201 | 2.669 |
| B | 2.351 | 3.516 | 1.633 | 5.104 | 2.535 | 3.583 | 2.064 | 3.915 | 1.926 | 1.924 |
| C | 2.132 | 3.728 | 3.764 | 3.263 | 3.51 | 2.6 | 3.23 | 3.082 | 1.873 | 1.628 |
| D | 4.094 | 3.081 | 3.693 | 4.569 | 2.961 | 2.611 | 2.709 | 1.621 | 1.667 | 1.242 |
| E | 3.678 | 3.564 | 4.182 | 4.47 | 3.321 | 2.942 | 2.92 | 3.063 | 1.986 | 1.282 |
| F | 3.572 | 3.142 | 3.952 | 3.6 | 3.302 | 2.913 | 2.738 | 3.178 | 2.347 | 1.499 |
| G | 3.168 | 3.122 | 3.275 | 3.163 | 2.46 | 2.919 | 2.609 | 2.783 | 1.552 | 1.418 |
| H | 1.951 | 1.271 | 2.35 | 2.016 | 2.46 | 2.257 | 1.531 | 1.195 | 1.389 | 1.559 |
| I | 1.084 | 1.207 | 0.89 | 2.024 | 1.489 | 1.738 | 2.122 | 1.239 | 1.933 | 1.228 |
| J | 1.875 | 1.34 | 1.307 | 1.921 | 1.741 1 | 1.436 | 0.941 | 0.865 | 1.18 | 1.305 |
| K | 2.268 | 0.873 | 1.034 | 0.67 | 0.947 | 1.113 | 0.757 | 0.998 | 0.96 | 0.941 |
| L | 1.949 | 1.115 | 0.955 | 0.993 | 1.038 | 0.854 | 1.014 | 0.733 | 1.084 | 0.651 |
| M | 2.092 | 1.021 | 0.936 | 0.576 | 1.161 | 0.52 | 0.585 | 1.023 | 1.213 | 1.091 |
| N | 1.355 | 1.02 | 0.809 | 0.459 | 0.524 | 0.66 | 0.555 | 0.374 | 0.572 | 0.434 |
Table 1: An overview of the sample quantities, converted from relative fluorescence units (RFUs) to concentration (ng/μL) based on the standard curve. Using the standard curve equation, we solved for concentration: [DNA] = (RFU-48.781)/256121.
All library quantitation results from the 18-cycle cDNA library plate (carried through miniaturized Nextera XT) are printed in the table, using the given standard curve generated by the Echo Liquid Handler. These two electropherograms are representative of what the average fragment length is, approximately 237bp. Using this data, we generated a normalization worklist to achieve equimolar representation of each sample, when possible. The Echo 525 Liquid Handler was then used to simultaneously pool and normalize the libraries in two minutes. The pool was then denatured and diluted to 20pM, loaded with 1% PhiX control, and run on an Illumina MiSeq specifying 2x75 reads.
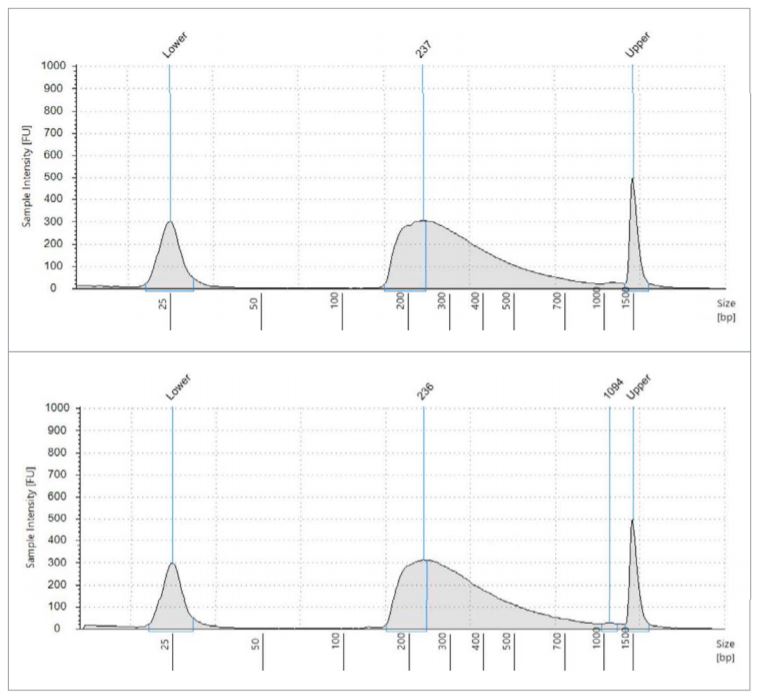
Figure 3: Fragment size analysis electropherograms of a few representative samples.
MiSeq Run Metrics for Nextera XT Workflow
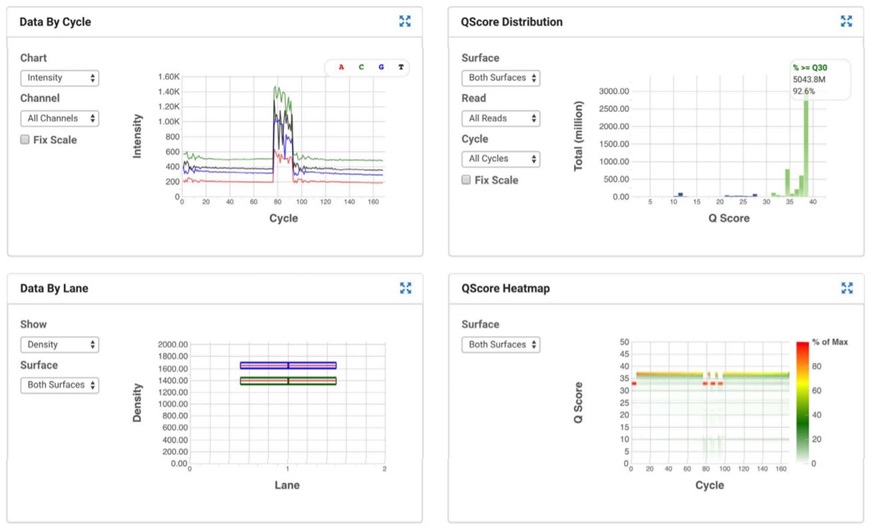
Figure 4: MiSeq run metrics of the 18-cycle cDNA samples that were processed through miniaturized Nextera XT
MiSeq run metrics were within specifications and 92.6% of the data is between Q30 and Q40, indicating quality, reliable reads from the instrument. We then checked the read distribution by index/sample.
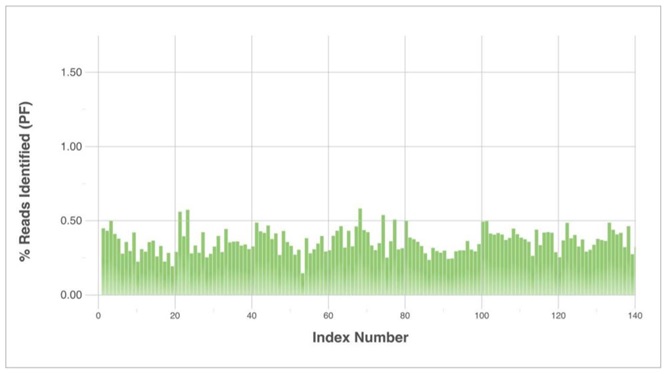
Figure 5: Index distribution of samples from the 18x cDNA library (carried through miniaturized Nextera XT) from Illumina BaseSpace.
Reads were distributed amongst the samples as shown above. There were a few samples that came from below-threshold cDNA libraries, which resulted in some underrepresentation. Furthermore, there are indexing biases that alter the efficiency of a given sample and how well it binds to the flow cell for reading in the MiSeq. Samples under 100,000 total reads were considered statistically too low to be included in the RNA Express analysis pipeline on Illumina BaseSpace. This is a cutoff determined by the software.
To assess whether SMART-Seq reaction volume and RNA input quantity of 18x cycles would reproduce data across those variables in transcript levels, we ran these samples through the Illumina BaseSpace app, RNA Express. This pipeline performs three major steps: alignment of RNA-Seq reads with the STAR aligner, assignment of aligned reads to genes, and differentiating gene expression with DESeq2. One set of replicates was chosen, at random, to be the control group, to which all other samples are referenced.
Differential Expression
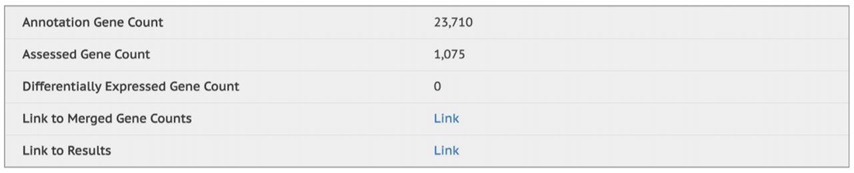
Figure 6: Summary statistics from the RNA Express software pipeline in Illumina BaseSpace. It shows that in this data set, 1,075 genes were assessed, and the software found 0 of them to be differentially expressed.
Control vs. Comparison
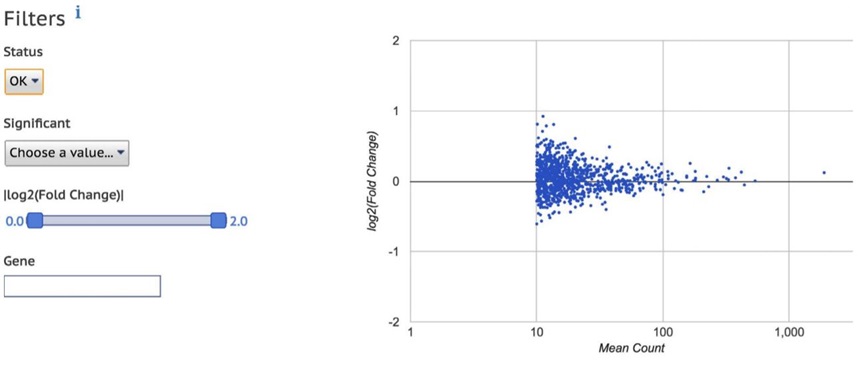
Figure 7: This dot plot graph shows all the assessed genes compared to the randomly chosen control replicates. We see that the expression does not differ by two-fold for any of them, which the software calls as no statistical difference in expression. We also see that as the mean count of gene is increased (moving right), the variation in expression decreases and approaches 0, which indicates there is no fold-change in expression.
Sample Correlation Matrix
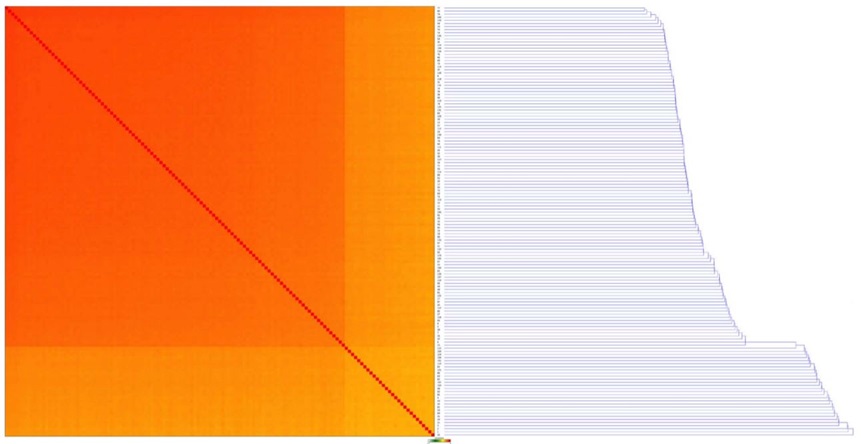
Figure 8: A Sample Correlation Matrix, showing a heatmap with the relative similarity between all replicates in this analysis. Each row and column represents one replicate, ordered by similarity (hierarchical clustering). The color of each field indicates the Spearman Rho correlation between these replicates. Dark orange is a correlation of 1 and lightening up to green and white indicates a correlation of -1.
Figure 6 represents summary statistics from the RNA Express analysis. It shows that we do not have any statistically significant differentially expressed gene counts, which we expect given all samples were sourced from the same RNA. The dot plot graph in Figure 7 shows that there are not any significant expression differences, all of them being within a two-fold difference. The graph further shows that with higher mean count of a certain transcript, the variation drops. In the sample correlation matrix (Figure 8), it shows a heatmap with the relative similarity between all replicates in this analysis. Each row and column represents one replicate, ordered by similarity (hierarchical clustering). The color of each field indicates the Spearman Rho correlation between these replicates. A dark orange color represents a correlation of 1 and lightening up to green and white indicates a correlation of -1. We see very strong positive correlation for the transcripts across samples.
This gives us confidence that our Echo system-enhanced miniaturized SMART-Seq v4 process can be used with a variety of sample input amounts, and with the sufficient amount of cycling, generate cDNA libraries. We further show that our miniaturized Nextera XT process can produce quality data and good sequencing metrics. Finally, the analysis shows that the entire process does not introduce significant bias to transcript levels in this RNA-seq experiment.
Conclusion
As scientists continue to push the limits of our genomics tools and understandings, RNA sequencing experiments are growing in quantity, variety, and experimental demands. We see diversity in the questions being asked, as well as the inputs for experimental analysis, so we aimed to determine the optimal parameters for producing sufficient amounts of sequencing data at a cost-effective volumetrically-reduced process.
We found that miniaturization of SMART-Seq v4 can produce sufficient library for sequencing, across reaction sizes, with PCR cycling of 18. We showed that varying reaction miniaturization and input RNA in this 18-cycle sample set did not produce any differentially expressed genes. We also found that the variables of input RNA, amount of reaction miniaturization, and amount of PCR cycling are all interconnected. For example, low-input RNA experiments will require additional PCR cycling, especially if the reaction volume has been reduced significantly. Increasing sample RNA input or reaction volume will reduce the amount of PCR cycling necessary (and subsequent PCR bias), but the reagent cost savings will be less drastic. It is very much up to the user and the defined experiment to balance the cost-savings and throughput with the amplification bias in both SMART-Seq v4 and Nextera XT.
Materials
| Equipment | Manufacturer |
| Echo 525 Liquid Handler | Beckman Coulter Life Sciences |
| Allegra X-14 Centrifuge | Beckman Coulter Life Sciences |
| MixMate | Eppendorf |
| Qubit | Thermo Fisher |
| TapeStation 2200 | Agilent |
| BMG PHERAstar | BMG Labtech |
| ProFlex PCR System | Thermo Fisher |
| 384-well Post Magnet Plate | Alpaqua |
| MiSeq | Illumina |
|
Reagents |
Manufacturer | Manufacturer |
| SMART-Seq v4 Ultra Low Input RNA Kit | Clontech | #634892 |
| Human Brain Total RNA | Thermo Fisher | #AM7962 |
| Nextera XT DNA 96-Sample Prep Kit | Illumina | #FC-131-1096 |
| Nextera XT Index Kit v2 Set A | Illumina |
#FC-131-2001 |
| PhiX Control v3 | Illumina | #FC-110-3001 |
| KAPA HiFi HotStart ReadyMix (2X) | KAPA Biosystems | #KK2602 |
| 16S rRNA V4 Region Primers | Integrated DNA Technologies | Custom Oligos |
| TapeStation D1000 HS Kit | Agilent | #5067-5584, #5067-5585 |
| Qubit dsDNA HS Assay Kit | Thermo Fisher | #Q32851 |
| Quant-iT Picogreen dsDNA Assay Kit | Thermo Fisher | #P11496 |
| Agencourt AMPure Beads | Beckman Coulter | #A63881 |
| 200 Proof Ethanol | Sigma Aldrich | #E7023 |
| MiSeq Reagent Kit v3 (600-cycle) | Thermo Fisher #P11496 Agencourt AMPure Beads B |
#MS-102-3003 |
| Consumables | Manufacturer | Part Number |
| 384-well PP Microplate | Beckman Coulter Life Sciences | 001-14555 |
| 384-well LDV Plus Microplate | Beckman Coulter Life Sciences 0 | 001-12782 |
| TapeStation Plate | Agilent | #5067-5150 |
| Qubit Microtube | Thermo Fisher | #Q32856 |
| 384-well PCR Plate | Bio-Rad | #HSP3805 |
| 384-well Black Flat Clear-Bottom Microplate | Greiner | #781096 |
| 1.5 mL DNA LoBind Tubes | Eppendorf | #022431021 |
