Simultaneous Isolation and Parallel Analysis of gDNA and total RNA for Gene Therapy
Introduction
Viral vectors, including adeno-associated vector (AAV), are an effective tool to deliver transgenes into the host cells. For this reason, viral vectors have been the key enablers for preclinical and clinical research applications in gene therapy. The frequency of vector transduction of targeted cells and organs can affect the efficacy, and there are two key ways to measure success: vector copy number (VCN) and transgene expression. VCN can be determined by extracting genomic DNA (gDNA) from bulk cells/tissue and utilizing quantitative PCR (qPCR) to determine the total number of viral genomes. This number represents the average copy number of the viral vector delivered to the whole population. The viral vectors also need to maintain transgene expression at an appropriate level and duration to efficiently deliver the therapeutic effect, which is measured by extracting and quantifying RNA through similar methods.
In the preclinical study phase, VCN and transgene expression are often tested from the same sample to ensure the accuracy and reproducibility of treatment performance. To do so, both DNA and RNA are extracted from the same biologic sample. Some existing protocols achieve simultaneous DNA and RNA extraction by splitting the lysate into two portions, then treating the portions of lysate with either DNase or RNase A. The drawback of this method, however, especially for precious samples, is that half of the DNA or RNA is lost.
In this application note, we demonstrate a simultaneous high-quality DNA and RNA extraction method that does not require splitting the sample lysate. This method has shown consistent performance across species with 10 different tissue types and 9 regions of the brain. The technique uses SPRI bead-based technology that selectively binds DNA and RNA to the beads and effectively separates DNA and RNA independently.
Materials and Methods
Sample preparation
AAV was administered to mouse and non-human primate (NHP) models. At the end of each experiment, tissue samples (adrenal gland, brain, gonads, heart, kidney, liver, lung, skeletal muscle, spinal cord, and spleen) were harvested and all tissue samples were snap-frozen in liquid nitrogen before nucleic acid extraction. The tissue size collected for this demonstration was around 15 mm3. It is worth noting that sample composition may vary within the same tissue type and between different tissue types due to collection variation during a large cohort of tissue harvest. The mass of each tissue type also differs and could be another factor contributing to the yield variation between tissue types.
Harvested tissues were first incubated and homogenized with RNAdvance Tissue Lysis buffer and Proteinase K at 37°C for 25 minutes. Next, samples were centrifuged at 12,000 rpm for 1 minute to remove undigested tissue and any cell debris. Finally, sample lysate was transferred to a 96-well plate from which sample extraction can be achieved using either a manual or automated process.
Simultaneous DNA and RNA extraction
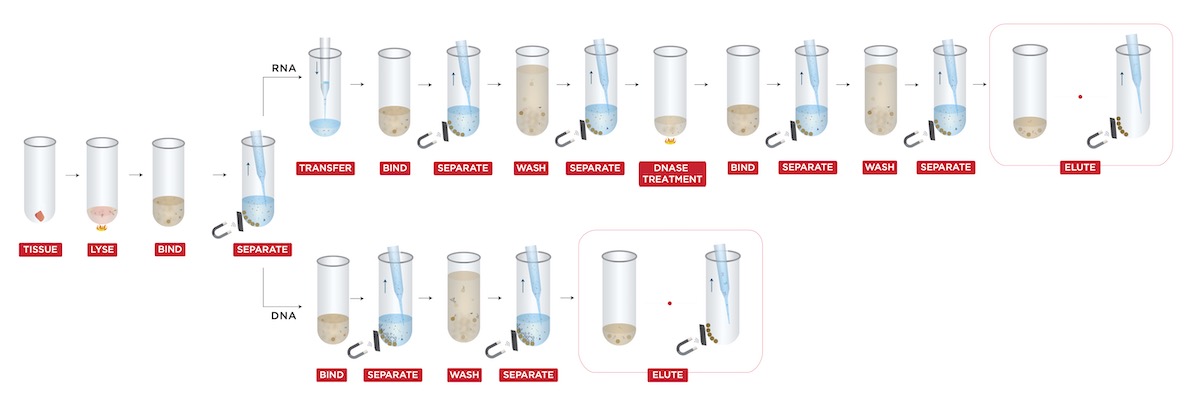
The extraction was performed by using a custom protocol (Figure 1) for “Simultaneous DNA & RNA Extraction from Tissue without Splitting Lysate” (Beckman Coulter Life Sciences, U.S.).
- Manual extraction method
Sample lysate was first mixed with FormaPure XL Bind Buffer (BBA). Next, the lysate and BBA mixture were incubated at room temperature for 5 minutes. After incubation, samples were placed on the magnet until the beads were settled. Both the supernatant (RNA) and beads (DNA) were saved for purification steps.
For RNA purification: the supernatant was incubated with BBA for the second time. After incubation, the beads were washed with 80% ethanol three times to remove impurities, followed by DNase treatment and Rebind Buffer (RBA) incubation. Finally, an additional wash was applied, and RNA was eluted in a final volume of 40 μL RNase-free water.
For DNA purification: the beads were first treated with RNase, then washed with 70% ethanol. Finally, the DNA was eluted into 40 μL RNase-free water.
- Automated extraction method
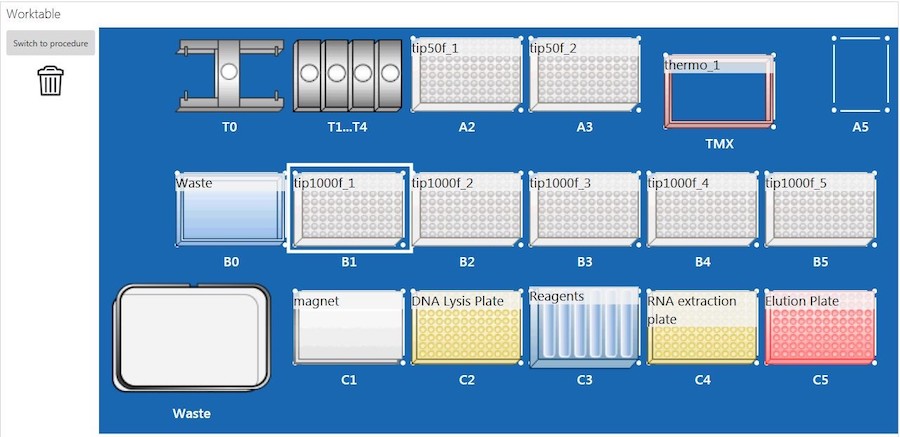
The sample lysate plate was placed on an EpMotion 5075t system (Eppendorf, Germany) (epBlue, version: 40.7) with the deck set up according to Figure 2, and nucleic acid extraction was performed. Briefly, the EpMotion 5075t system first transferred BBA to the sample lysate plate. The lysate and BBA mixture was incubated at room temperature for 5 minutes. After incubation, samples were placed on the magnet until the beads were completely settled. The supernatant (RNA) in the RNA extraction plate (Figure 2, C4) was processed with purification on deck, and the RNA was eluted into a new 96-well plate (Figure2, C5). Due to the EpMotion 5075t deck space limitation, the plate containing DNA (DNA lysis plate, Figure 2, C2) was taken off the deck for RNase treatment during ongoing RNA purification. Once the RNA purification was completed, the DNA lysis plate was put back on the deck for DNA purification.
Assessing nucleic acid yield and quality
DNA and RNA from all tested tissues were quantified with Invitrogen Quant-iT Assay Kits (ThermoFisher Scientific, U.S.). RNA quality was assessed using an Agilent Bioanalyzer Instrument, and genomic DNA quality was measured using an Agilent Tapestation Instrument (Agilent Technologies, U.S.).
Results and Discussion
The automated extraction method takes about 4 hours to run 96 samples per batch with a total hands-on time of 10 minutes split over three human intervention steps; plate the sample lysate on deck, operate the software, and reset the deck for DNA extraction. It is worth mentioning that DNA and RNA extraction were conducted sequentially due to epMotion deck space limitation, and that the total run time can be decreased if an additional or more spacious liquid handler is available.
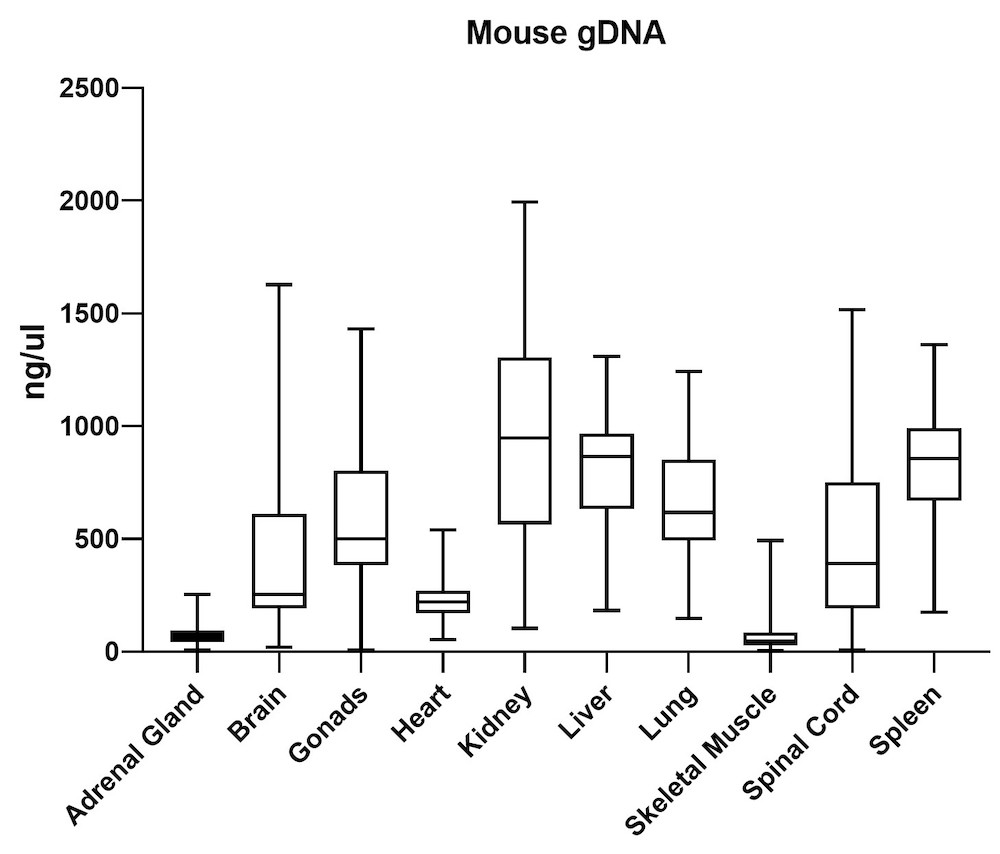
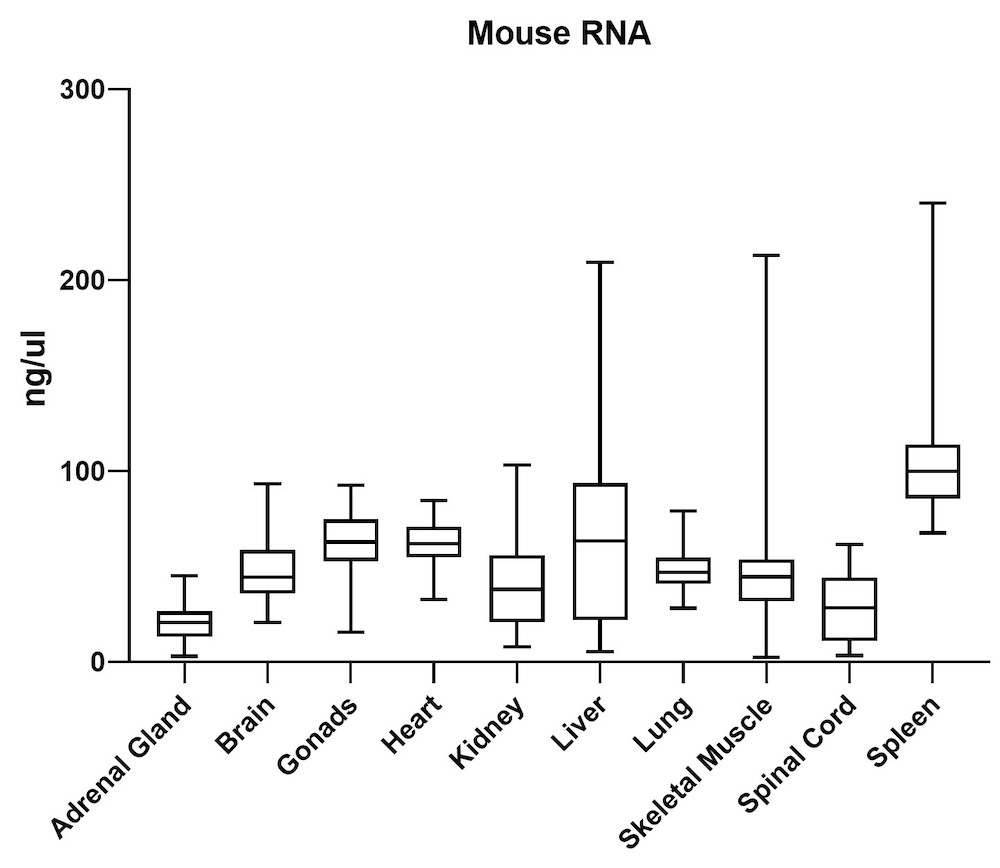
The average gDNA and RNA yield (Figure 3) from all mouse tissue types (total of 10) passed the minimum yield cut-off of 25 ng/μL for DNA and 6.25 ng/μL for RNA (Summary of yield is listed in Table 1, n=72/tissue type). Yield varied from tissue types such as gonad, lung, and lymph node. However, the yield remains consistent for all brain areas, indicating the variation comes from different sample inputs affected by the sample collection practice.
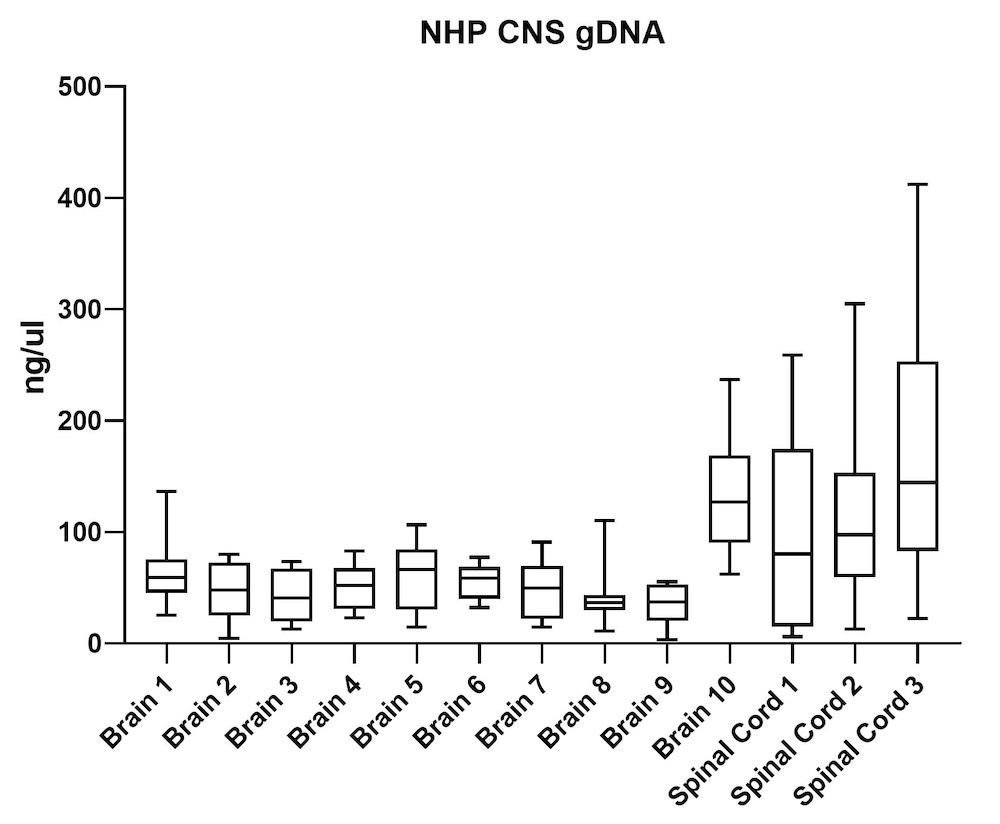
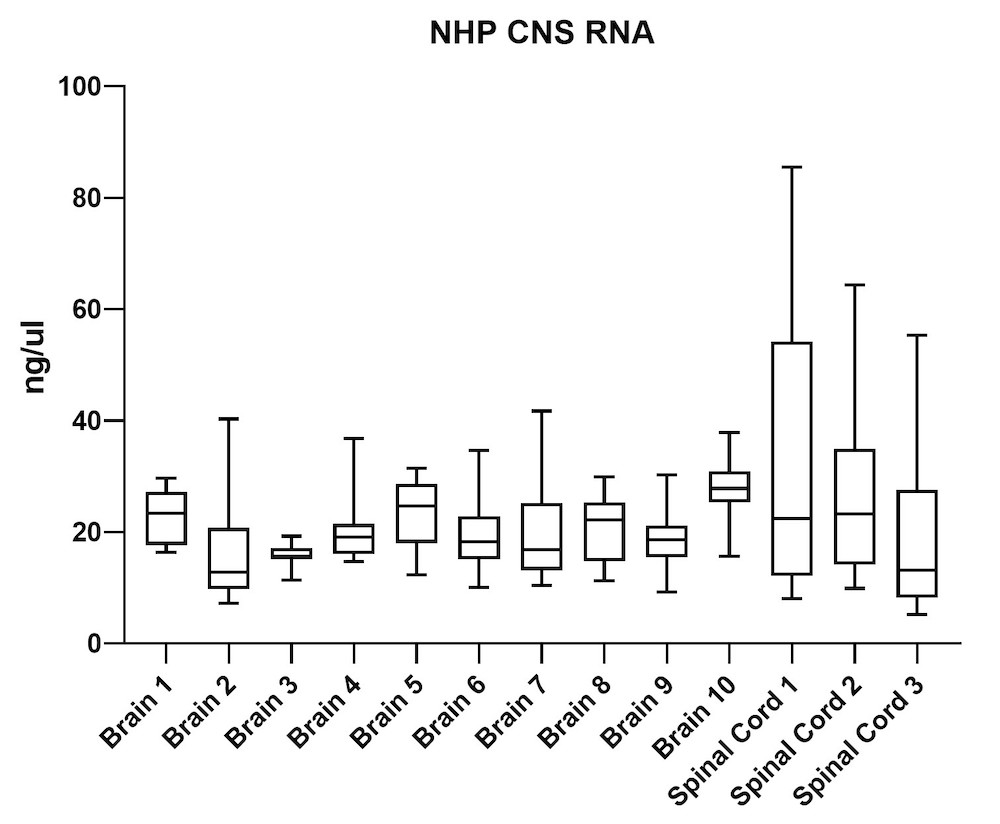
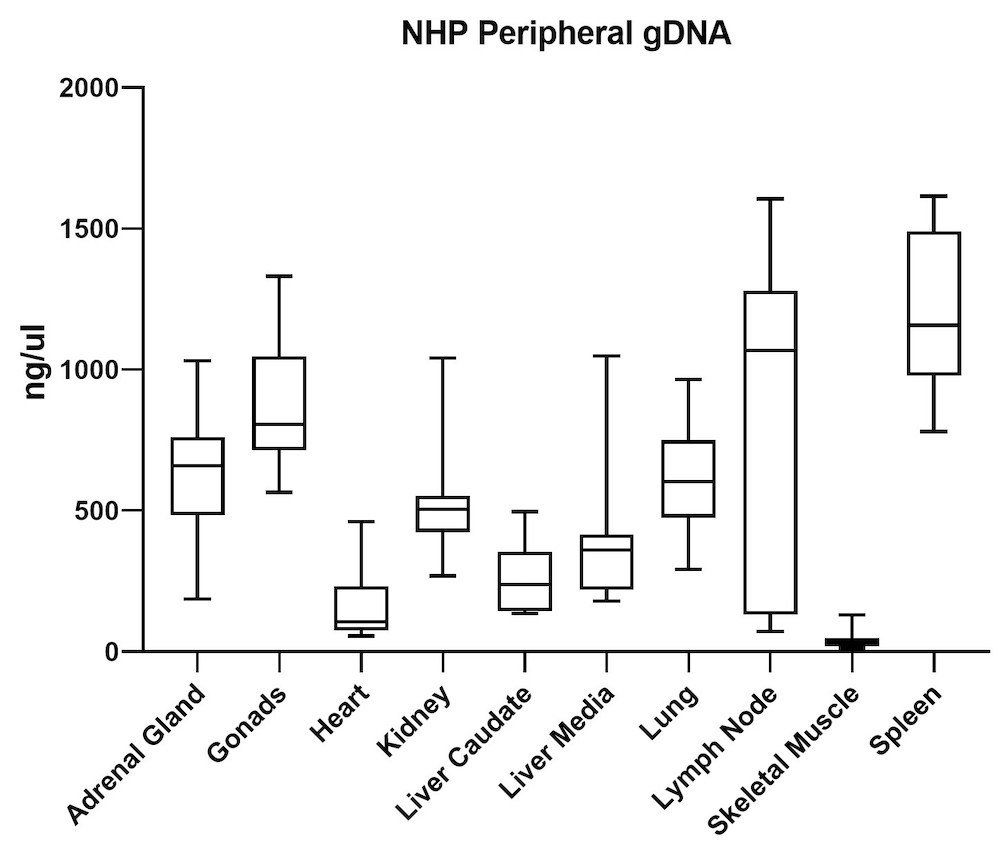
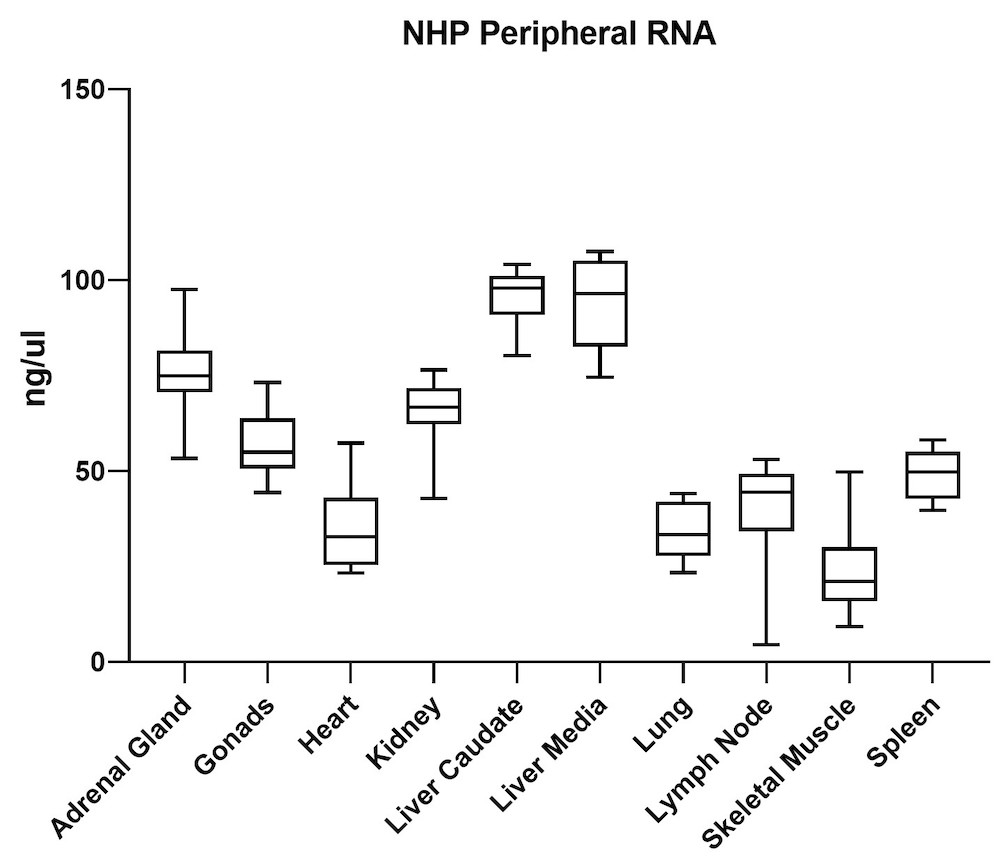
Although the mouse model provides valuable information regarding viral vector safety and biopotency in preclinical trials, large models such as NHP should be used to improve therapeutics. For this reason, we also tested the simultaneous DNA and RNA extraction from NHP on the epMotion system. As a result, we observed that gDNA and RNA yields from NHP CNS (Figure 4) and peripheral tissues (Figure 5) pass the minimum yield requirement for downstream tests (Summary of yield is listed in Table 2, n=11/tissue type).
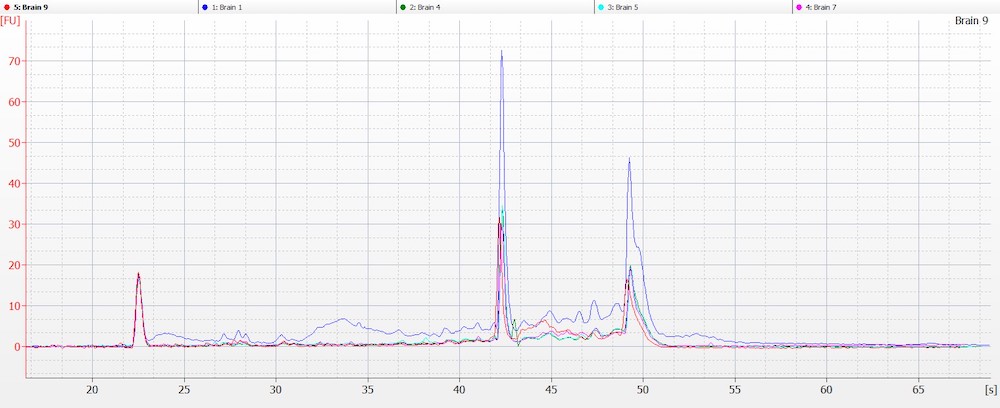
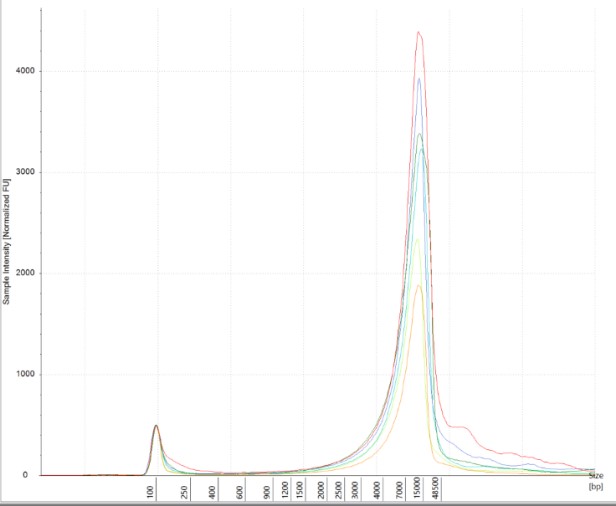
Obtaining intact DNA and RNA can help ensure high-quality downstream assay results and improve reproducibility. DIN (DNA Integrity Number) and RIN (RNA Integrity Number) were assessed to determine DNA and RNA quality from brain tissue samples. The brain tissue was utilized as a representative tissue for nucleic acid quantity because it is considered a more difficult tissue to work with due to its high liquid content. The high quality of the RNA and DNA was observed electrophoretically. An average RIN=7.9 and DIN=7.2 (Figures 6 A and B) were seen across all brain tissue samples, which further proved the reproducibility of the extraction method.
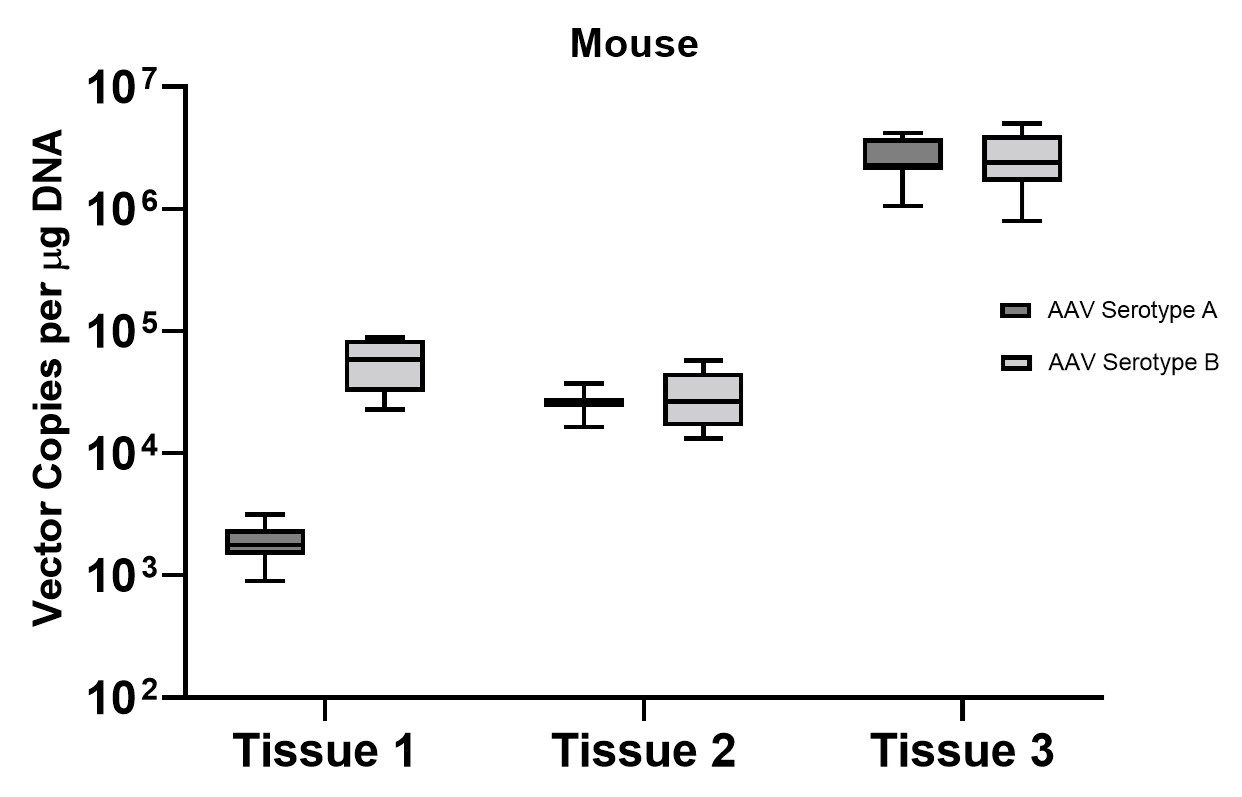
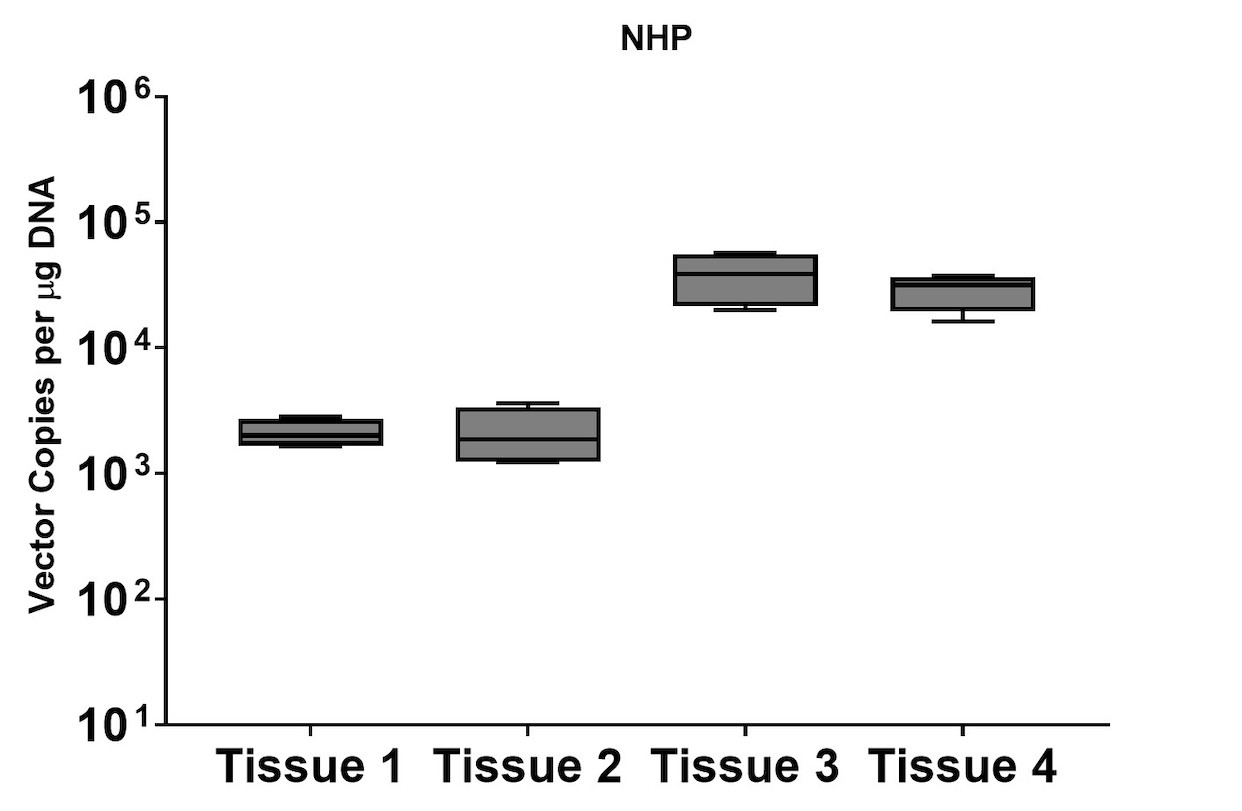
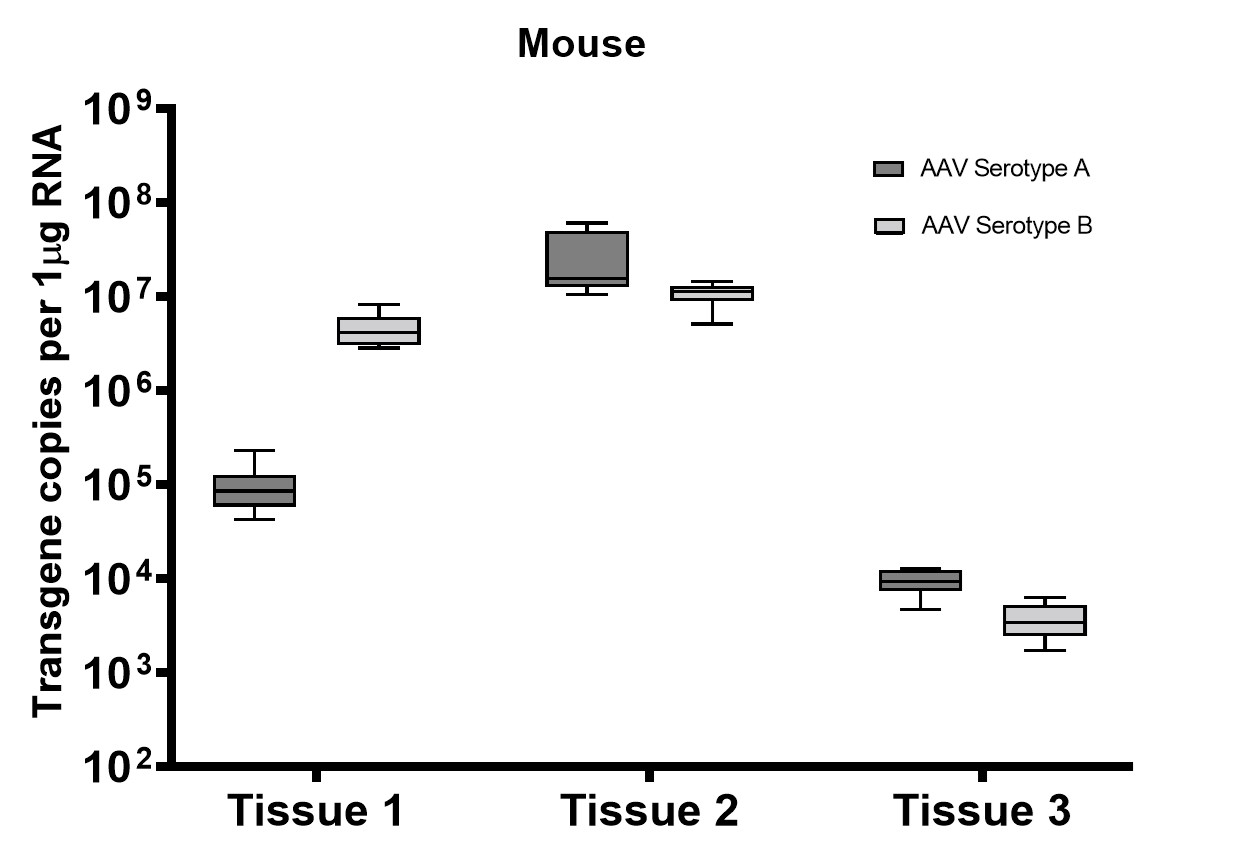
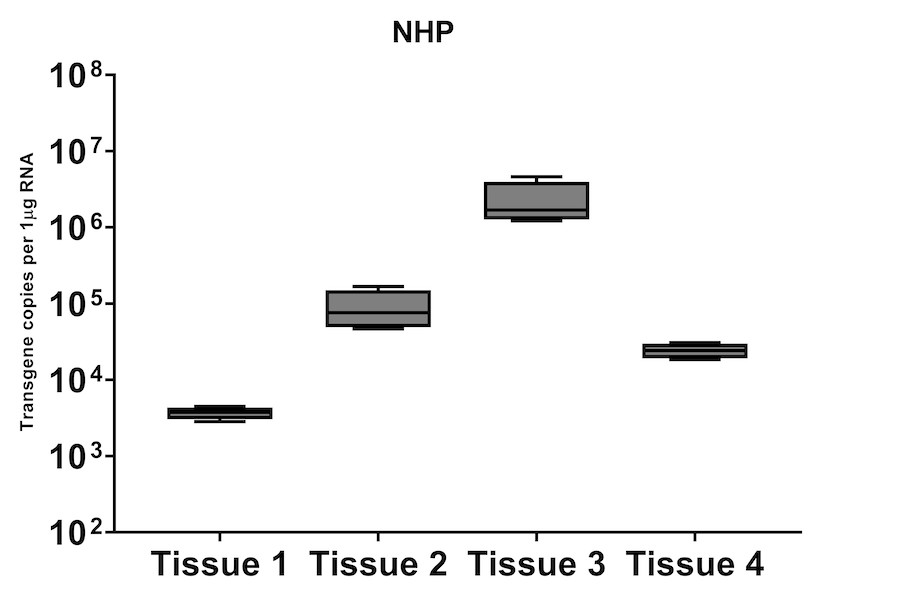
A subset of vector copy number and transgene expression was demonstrated using the extracted DNA and RNA above. Vector genome copies in tissue samples were quantified by real-time PCR (qPCR). In the mouse model, DNA from a total of two different AAV serotype-treated tissues was analyzed. We observed transduction across all the tissues, and the data indicated both AAV serotypes were very efficient at entering each tissue type (Figure 7A). In addition, the level of transgene expression (copies/1 μg RNA) varies among the tissue types (Figure 8A). We observed the same patterns of VCN and transgene expression in NHP models (Figure 7B and 8B).
The demonstrated simultaneous DNA and RNA extraction method simplifies nucleic acid isolation workflow and provides a streamlined method to characterize viral vectors. The technique depends on different nucleic acid sizes, and SPRI technology selectively binds DNA and RNA to magnetic particles— because DNA can nonselectively bind to magnetic particles, while RNA, which is typically smaller, remains in solution. Alternatively, RNA may also be induced to bind to the beads by increasing the concentration of the solution.
Conclusions
A safe and effective viral vector is key to delivering efficient gene therapy treatments. The ability to measure vector copy and transgene level at all development steps provides a powerful approach to characterizing viral vectors, which helps ensure therapeutic quality and safety. Conducting simultaneous DNA and RNA extraction manually to measure both genomic (VCN) and transcriptomic levels (transgene) of viral vectors requires a simple workflow, saves time spent on the extraction process, and meets requirements for a large cohort of samples. This protocol is also automation-friendly and can easily fit on a laboratory’s existing automation. The flexibility to implement this extraction protocol on different automation platforms minimizes the risk of human errors, ensures consistent extraction performance, and decreases hands-on time.
| Tissue Type | Average yield (ng/uL) | |
|---|---|---|
| gDNA | RNA | |
| Adrenal Gland | 68 | 20 |
| Brain | 419 | 48 |
| Gonads | 568 | 60 |
| Heart | 225 | 62 |
| Kidney | 950 | 38 |
| Liver | 820 | 64 |
| Lung | 669 | 48 |
| Skeletal Muscle | 66 | 45 |
| Spinal Cord | 513 | 21 |
| Spleen | 834 | 108 |
| Tissue Type | Average yield (ng/uL) | |
|---|---|---|
| gDNA | RNA | |
| Brain 1 | 66 | 23 |
| Brain 2 | 46 | 15 |
| Brain 3 | 43 | 16 |
| Brain 4 | 51 | 20 |
| Brain 5 | 63 | 23 |
| Brain 6 | 56 | 20 |
| Brain 7 | 48 | 19 |
| Brain 8 | 39 | 20 |
| Brain 9 | 34 | 18 |
| Brain 10 | 129 | 28 |
| S. Cord 1 | 98 | 34 |
| S. Cord 2 | 109 | 26 |
| S. Cord 3 | 163 | 19 |
| Adrenal Gland | 646 | 76 |
| Gonad | 889 | 57 |
| Heart | 157 | 36 |
| Kidney | 527 | 66 |
| Liver Caudate | 258 | 96 |
| Liver Media | 392 | 94 |
| Lung | 602 | 35 |
| Lymph Node | 789 | 38 |
| Sk Muscle | 38 | 24 |
| Spleen | 1213 | 49 |